


The $6 Billion Question: Reality-Checking Baker’s Claimed Cost of Extra Climate Protection
In the flurry of activity at the end of 2020, two landmark (though long-expected) climate visions were put forward by different branches of the Massachusetts government. One, offered by the Executive Office of Energy and Environmental Affairs and backed up by its comprehensive draft Clean Energy and Climate Plan for 2030, called for the state to reduce its greenhouse gas (GHG) emissions in the year 2030 by 45% compared to 1990 emissions. The other, a bill passed with overwhelming legislative support entitled “An Act creating a next-generation roadmap for Massachusetts climate policy”, called for a 50% reduction by 2030, instead of 45%, among many other positive provisions. On January 14th, Governor Baker vetoed the bill. But with the arrival of the 2021 session, the legislature passed the same bill again on January 28th, which the Governor must sign or veto by February 7th (although the large majorities in both bodies’ initial vote mean the legislature could override any veto).
Acadia Center has already debunked other claims in the Governor’s first veto. In his explanatory letter, the Governor claimed unlocking that extra 5% of GHG savings (the difference between 45% and 50%) would come with an extravagant cost: $6 billion more, to be exact. That figure, and how the Governor’s Office arrived at it, has touched off a number of conversations within the legislature and environmental advocacy community, because there has been little information revealed about where it came from.
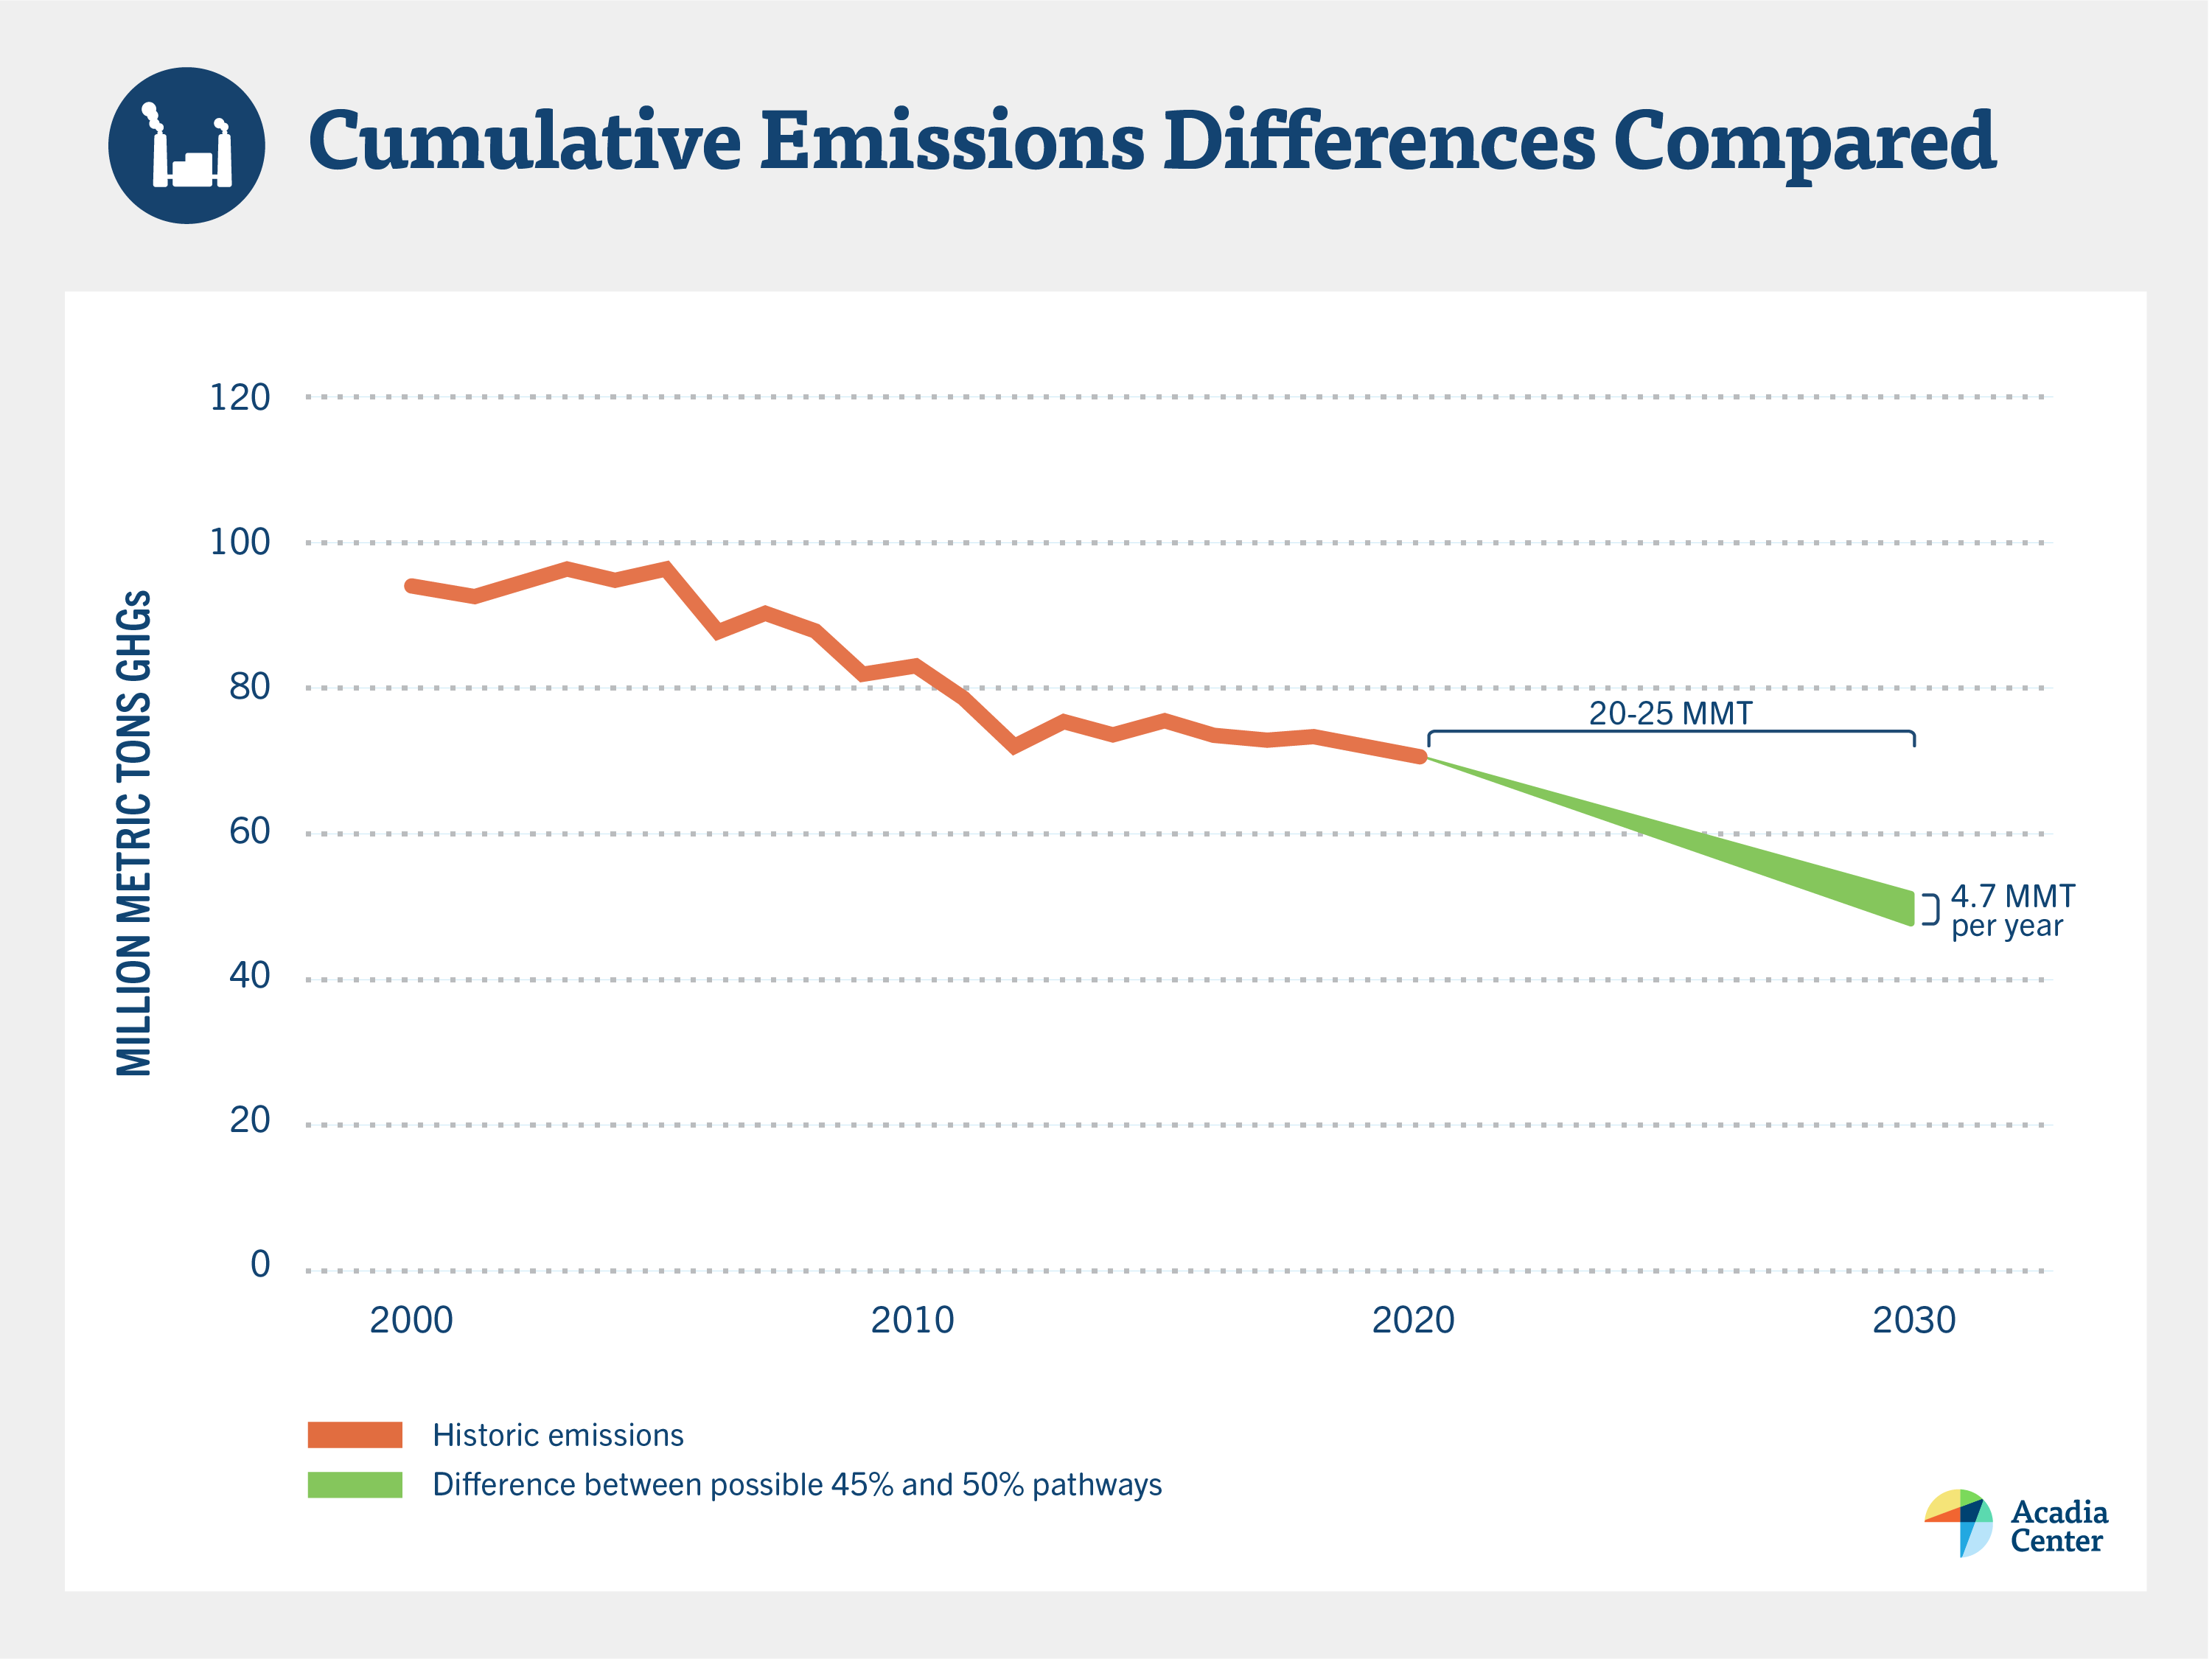
Despite this, one can still infer valuable information from the Administration’s estimates for 2030. To explore this further, it is important to distinguish between an annual and a cumulative value. If, by 2030, Massachusetts reduced its annual emissions by 50%, the state would be emitting about 4.7 million metric tons[1] of GHGs less, annually, than if it only achieved a 45% reduction. Assuming those two reduction pathways gradually diverge between 2020 and 2030, that means – with a little help from high-school geometry – that the cumulative difference would be around 20-25 million metric tons. This is the triangular “wedge” of GHGs shown in the chart below, and this wedge, according to the Administration, is what costs $6 billion extra.
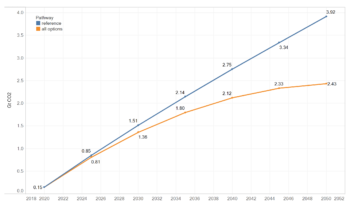
Now consider two important charts, included below, taken from December’s Massachusetts 2050 Decarbonization Roadmap reports, which contain the technical analyses that underpin policies set forth in the Clean Energy and Climate Plan, or CECP. These two charts show cost and emission differences between the study’s “All Options” scenario, which by 2030 attains GHG reductions of 47% compared to 1990[2], and its “Reference” scenario, which attains reductions closer to 15%. Reading the charts, it appears the “All Options” scenario cumulatively avoids about 150 million metric tons of GHGs and costs roughly $4.75 billion more than “Reference” by the year 2030.
To phrase it another way, the Roadmap analysis suggests that the average cost to get from 15% to 47% (and avoid about 150 million metric tons of emissions by 2030) is about $32 per metric ton avoided. This figure is also in line with a recent Applied Economics Clinic paper that explicitly calculated carbon “abatement costs” for Massachusetts. But the Baker Administration, in their justification for a more restrained 2030 target, says that to go from 45% to 50% could cost almost ten times that amount: $240-$300 per metric ton[3]. It is no surprise that bigger emissions cuts cost more, and costs per ton escalate as the least expensive options are exhausted first. Here, increased costs could mean that some polluting cars and fossil-fueled heating equipment would be replaced before they completely wear out. But the vast difference between these numbers, both of which come out of the same Administration within a few weeks of one another, suggest that different math is being used to tackle the same question.
Figure 5 from the Economic and Health Impacts Report, showing annual costs for modeled scenarios versus the “Reference” scenario. The area below the brown “All Options” line shows the cumulative cost difference for that scenario to be approximately $4.75 billion between 2020 and 2030.
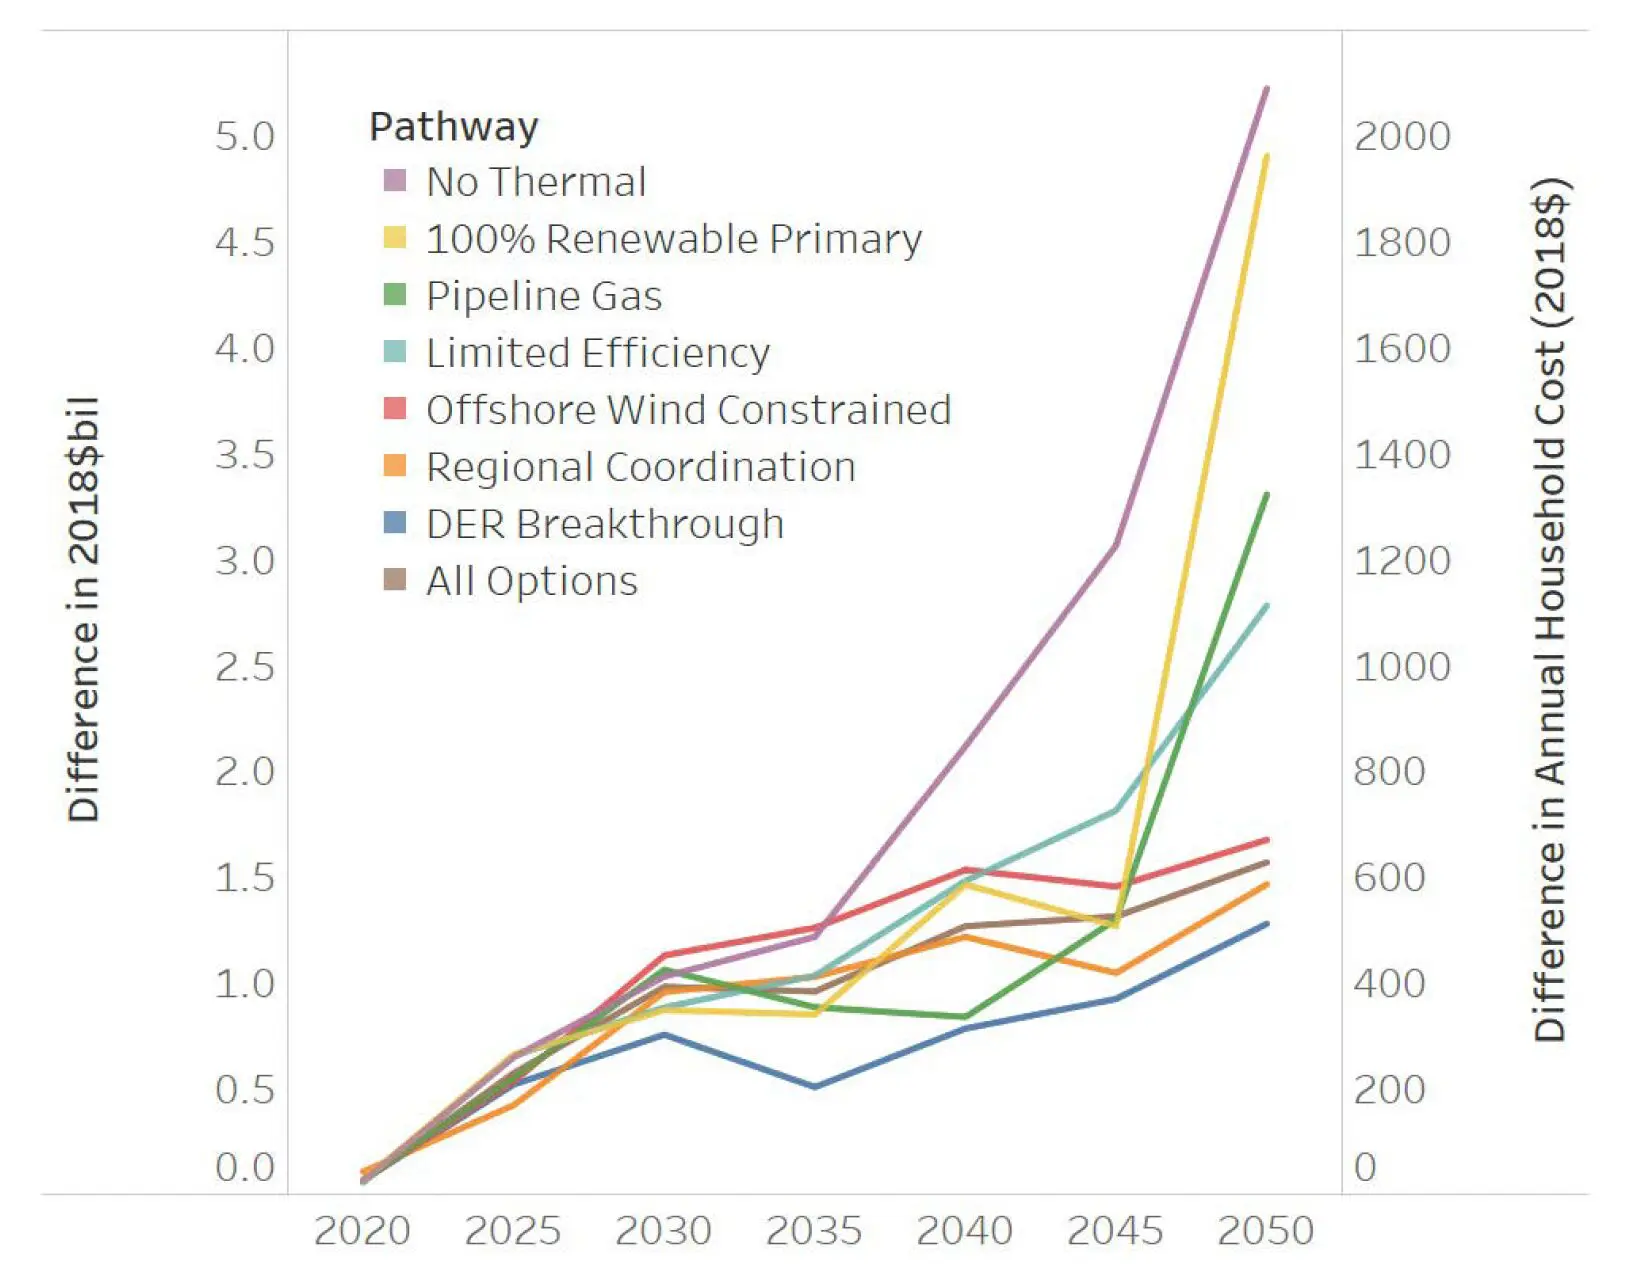
Figure 46 in the Energy Pathways to Deep Decarbonization Report, showing cumulative emissions for the “All Options” and “Reference” scenarios. By 2030, the accumulated difference between the two would be 150 million metric tons.
A recent Boston Globe article by David Abel sheds some light on the Administration’s math, focusing on what it would take to stretch beyond the 45% target. For example, the article cites members of the Administration who say the Commonwealth would need 450,000 additional electric vehicles (EVs), which alone would cost $2.4 billion. That would mean over $5 thousand per car in extra costs. But what about the lower fuel and maintenance costs that EV owners enjoy? Even Consumer Reports acknowledges that the total cost of ownership for EVs is less than a car running on gasoline. And what about the other benefits to the public from breathing cleaner air with almost half a million fewer fossil-powered cars on the road? It appears that the Baker Administration’s math may not be accounting for all the benefits in the same way that the Decarbonization Roadmap does.
To be clear, achieving either of these 2030 aspirations, whether 45% or 50%, would be a significant milestone in Massachusetts’ fight against climate change. All other things being equal, fewer total emissions are better than more, since what really matters is the accumulation of GHGs in the atmosphere. Acadia Center is a firm believer in evidence and data-backed policymaking, and the CECP is a tremendous accomplishment, founded on solid analysis. If the Baker Administration is going to use cost to explain why it opted for a less aggressive emissions target, Acadia Center simply feels that the same level of rigor should be brought to that decision as is seen in the Decarbonization Roadmap. Luckily, the bill containing the 50% goal is already back on the Governor’s desk. Acadia Center urges him to reevaluate his position – or at least base it on cost figures that are supported by evidence his own Administration has gathered.
Image credit: https://www.flickr.com/photos/massgovernor/50881414713/
[1] This can be calculated from the annual GHG emissions inventory.
[2] This value lies in between 25% in 2020 and 90% in 2050, and Acadia Center understands that the “All Options” scenario follows this straight line emissions trajectory.
[3] This is Acadia Center’s estimate of the range of marginal abatement costs implied by the Baker Administration’s letter. It relies on approximate values estimated from charts and simple reasoning, since the complete information needed to perform the calculation has not been provided.
Follow us