


Connecticut’s Clean Energy Moment
Connecticut is having a clean energy moment — one that could launch a new wave of progress if the right policy decisions are made. This opportunity comes as somewhat of a coincidence. Two key planning processes, the Governor’s Council on Climate Change and the state’s 2016 Comprehensive Energy Strategy, will likely intersect this year, with each issuing important policy findings in the coming months. These findings will guide the state’s actions on fundamental climate and energy issues for many years — with lasting consequences for Connecticut’s economy, public health, and environment.
Connecticut’s clean energy moment may also have legal significance. The state’s first mandatory greenhouse gas (GHG) emissions cap is just a little over three years away. Established by Connecticut’s Global Warming Solutions Act, this cap requires a 10% reduction from the 1990 emissions level by 20201 — a modest goal, but crucial to setting Connecticut’s emissions trajectory on a declining path to meet the much more important long-term GHG emissions cap in 2050, an 80% reduction from the 2001 emissions level.2 With so much at stake, Connecticut’s policymakers need to have the latest GHG emissions data and analyses to make well-informed decisions.
Toward that end, Acadia Center released an updated GHG emissions inventory for Connecticut this past June. Constructed with the best available data from public sources, this report gives a comprehensive look at emissions from 1990 through 2015 and also analyzes emissions trends in more recent years.3 The results are below.
Connecticut GHG Emissions Inventory, 1990-2015
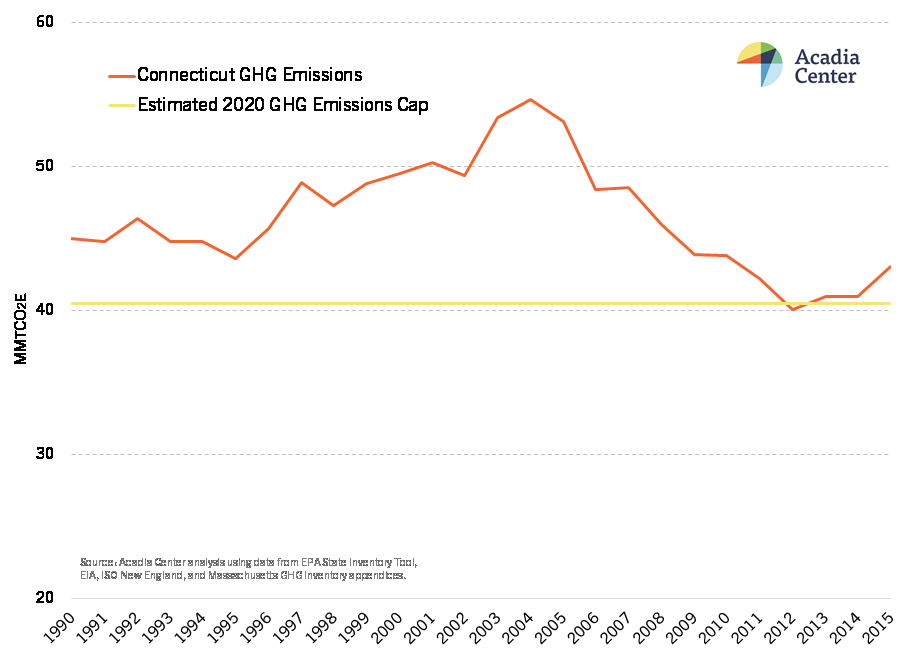
These results show a clear and concerning trend: GHG emissions have increased since a 2012 low and do not appear to be on track to meet the mandatory 2020 emissions cap. The recent uptick in emissions can be attributed to many factors outside Connecticut’s control, such as fuel prices, the economy, and weather, among others. The report explores those external factors in more detail.
However, even with these external factors, policymaking matters. Connecticut retains a significant degree of control over how much electricity it consumes, and thus how much carbon it emits. For example, New England states with more aggressive energy efficiency and solar policies than Connecticut will reap greater reductions in electricity consumption over the next six years, as shown below.
ISO New England Forecast – Change in Electric Consumption from 2016
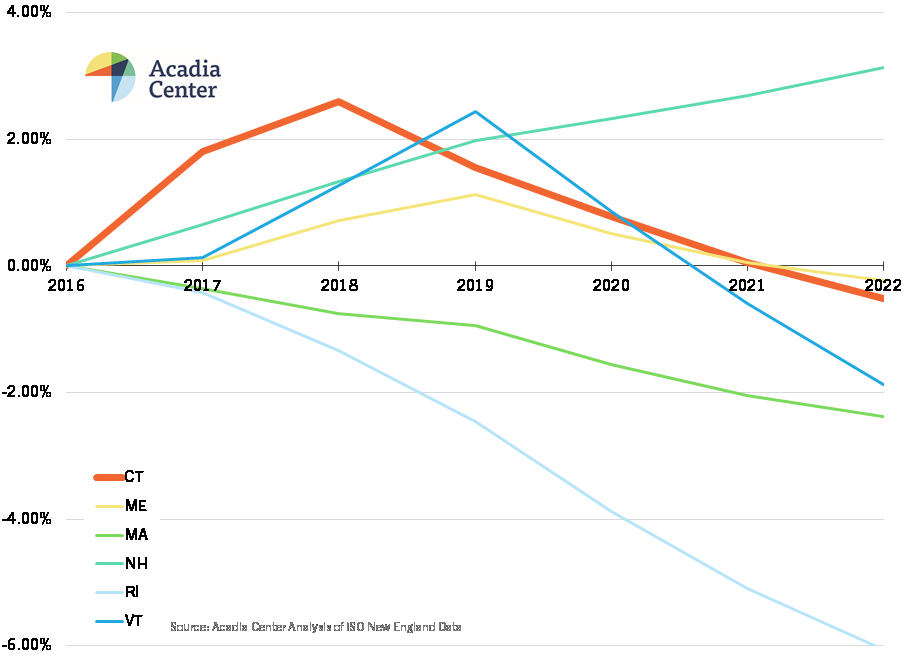
This chart shows that Connecticut’s energy policies have not kept pace with those in Massachusetts, Rhode Island, or Vermont. And this reality has climate ramifications. Connecticut will be taking on an increasing share of the region’s GHG emissions from electricity consumption, which then negatively impacts its carbon profile.
While it is too soon to predict with certainty whether Connecticut will meet its mandatory 2020 GHG emissions cap, implementing additional short-term mitigation measures will increase the likelihood of doing so. The most promising opportunities for short-term reductions are likely in energy efficiency, distributed solar PV, and electric vehicles. The state has existing programs for each of these options,4 which could be expanded quickly to significantly reduce GHG emissions before 2020. Pending clean energy procurements now before Connecticut officials could also play a major role in bringing down the state’s carbon profile in the short to medium term.5
Acadia Center looks forward to working with Connecticut and other stakeholders to ensure that the 2016 Comprehensive Energy Strategy and the Governor’s Council on Climate Change offer pragmatic policy recommendations that can launch a strong and effective mitigation effort. Connecticut needs to take full advantage of this clean energy moment to align its energy decisions with its climate goals.
1 Public Act 08-98, An Act Concerning Connecticut Global Warming Solutions, §2(a)(1) (“The state shall reduce the level of emissions of greenhouse gas…[n]ot later than January 1, 2020, to a level at least ten percent below the level emitted in 1990”).
2 See id., §2(a)(2) (“The state shall reduce the level of emissions of greenhouse gas…[n]ot later than January 1, 2050, to a level at least eighty per cent below the level emitted in 2001”).
3 Acadia Center has published multiple GHG emissions inventories for Connecticut beginning in 2003. The most recent used a traditional inventory approach through 2014. The current analysis described here is an update using a hybrid approach and 2015 data.
4 Connecticut offers high-performing statewide energy efficiency services through its Conservation and Load Management programs. Connecticut encourages the deployment of distributed solar PV through a residential incentive program offered by the Green Bank and through the Zero-Emission Renewable Energy Credit (ZREC) program administered by the electric distribution utilities. The CT Department of Energy and Environmental Protection oversees the CT Hydrogen and Electric Automobile Purchase Rebate (CHEAPR), which offers rebates for the purchase or lease of various low-carbon vehicles.
5 See the clean energy procurements enabled by Public Act 15-107, An Act Concerning Affordable and Reliable Energy, §1(c) (authorizing RFP for grid-scale clean energy resources) and §1(b) (authorizing RFP for energy efficiency and/or small-scale clean energy resources).
Bill Dornbos is the Director of the Connecticut Office and Senior Attorney for Acadia Center. Bill focuses on advancing policy and regulatory solutions that seek to transform the energy system and move Connecticut towards a climate-safe, sustainable future.
Mass. wants its neighbors to move faster to cut emissions
Overall, the cap-and-trade program has led to reduced emissions and lower energy prices, advocates say. Last year, the region produced about 83 million tons of carbon emissions, 37 percent less than in 2008, according to the Acadia Center, an environmental advocacy group in Boston.
In a report this year, the group found these states have reduced emissions by 16 percent more than other states, while the region’s economy has grown 3.6 percent more than the rest of the country. At the same time, energy prices have fallen by an average of 3.4 percent, while electricity rates in other states have risen by 7.2 percent.
“Adopting the 5 percent cap would signal that the RGGI states are taking climate change seriously and setting an example for the rest of the country that ambitious emissions reductions are achievable,” said Peter Shattuck, director of the clean energy initiative at the Acadia Center.
Read the full article from the Boston Globe, with additional figures based on Acadia Center data here.
Four Things You Didn’t Know about Energy Efficiency in Connecticut… And One You Might Have Guessed
1. Nutmeggers have saved more than 1.5 billion kilowatt hours (kWh) in energy over the last five years1
That’s equivalent to fully powering 169,000 houses in Connecticut for an entire year.2 For reference, Bridgeport, the largest city in Connecticut, has approximately 51,000 occupied housing units3 so with the energy saved over the last five years, we would have more than enough to power three cities the same size as Bridgeport for an entire year.
This number doesn’t even include the additional lifetime savings that we know will be realized in the future thanks to these investments in energy efficiency now. If you include those savings, Connecticut residents and businesses will save more than 18.3 billion kWh.4 That’s equivalent to:
- 2,058,030 houses powered for one year (1.5 times all of the occupied homes in Connecticut), or
- Millstone’s annual generation (Millstone is Connecticut’s largest power plant),5 or
- Combined annual generation of the next 15 largest power plants in Connecticut6
What do these savings mean in real terms? They mean lower overall energy demand and lower overall energy costs for everybody. Lower demand also means that the power grid can better handle times of peak use, such as the heights of summer and the depths of winter.
These energy savings translate to carbon dioxide emissions reductions of 13.5 million tons over the lifetime of these investments.7 That’s more than the amount of carbon sequestered by planting 300,000,000 trees and letting them grow for 10 years.8
2. Connecticut’s residents and businesses have achieved more than $3.8 billion in lifetime savings on their energy bills
Energy efficiency investments over the last five years will save Connecticut consumers approximately $3,818,900,0009 over the life of those investments. This is money that consumers don’t have to spend on their energy bills.
Most money that is spent on energy goes to large, out-of-state energy corporations, such as merchant generators that rely on natural gas to fuel their power plants. Money that isn’t spent on energy can instead be spent on goods and services right here in Connecticut. This local spending grows our economy and spurs job creation. The money saved by Connecticut’s 2015 investment in energy efficiency will end up generating approximately 9,258 new jobs, for example.10
3. Connecticut’s energy efficiency programs have served 242,222 homes over the last five years11
This number includes rebates for efficient HVAC systems, as well as 162,270 homes that were weatherized from 2011 to 2015. In 2015 alone, Connecticut’s Home Energy Solutions (HES) and Home Energy Solutions-Income Eligible (HES-IE) Programs served 55,166 homes.12 That’s more than the total number of housing units in Connecticut’s second largest city — New Haven.13
These programs provide energy auditing services that help residents assess how best to improve the energy efficiency of their homes. These statewide programs will even install many of these important improvements on the spot. They also offer price reductions for purchasing energy efficient appliances and products for the home.
4. Connecticut has converted enough energy efficient light bulbs to fill 300 average-sized swimming pools
A recent report sponsored by  Connecticut’s Energy Efficiency Board shows that LED and CFL bulbs have saturated 45% of the residential market in the state.14 This means that approximately 45% of household lighting in Connecticut uses these high-efficiency bulbs.
Using more efficient bulbs can significantly reduce energy consumption — and they’re more convenient because they last longer. LEDs in particular last 30 to 50 times longer than incandescent bulbs and use up to 85% less energy.
5. Connecticut has more work to do!
All of these impressive achievements are important, but there is more work to do.
Saturation of LEDs in Connecticut is only at 10%. LEDs out-perform CFLs in many ways: they are more energy efficient, they last longer, and people are happier with them. Connecticut’s energy efficiency programs need to continue to incentivize consumers to switch to LEDs to encourage even greater energy savings.
If the HES and HES-IE programs continue at their current pace, it will take almost 15 years to reach even half of the occupied houses in Connecticut. Expanded funding is vital in order to keep these crucial residential programs going strong.
Use of these valuable programs could also be improved. When a resident uses HES to assess and improve their home, HES usually recommends additional work to be done to improve the home’s energy efficiency. More of this additional work, such as adding attic, wall, or basement insulation, needs to be done in order to make Connecticut’s homes more efficient.
It is also worth noting that Massachusetts and Rhode Island are outperforming Connecticut in energy efficiency. The most recent energy efficiency savings rates in Massachusetts and Rhode Island are 3.04% and 2.9% per year, respectively, while Connecticut is at 1.53% — strong nationally, but regionally only half of its leading neighbors. This means that Connecticut’s energy efficiency programs could be eliminating double the energy waste that they currently do. Imagine twice the energy saved, twice the carbon pollution avoided, and twice the cash saved on energy bills!
1 Calculation from adding up annual savings reported in the Energy Efficiency Fund’s Annual Legislative Reports from 2011 to 2015.
2 Based on average of 8,892 kWh annually required per household.
3 Bridgeport has 51,255 occupied housing units according to the 2010 U.S. Census.
4 Calculation from adding up lifetime savings reported in the Energy Efficiency Fund’s Annual Legislative Reports from 2011 to 2015.
5 Based on Millstone’s gross generation for 2014. Data from: https://www.eia.gov/electricity/data/eia923/.
6 Based on gross generation of Connecticut’s power plants in 2014. Data from: https://www.eia.gov/electricity/data/eia923/.
7 From Energy Efficiency Fund’s Annual Legislative Reports from 2011 to 2015.
8 Based on 23.2 lbs of carbon per tree. Estimate given by EPA GHG Equivalencies Calculator: https://www.epa.gov/energy/ghg-equivalencies-calculator-calculations-and-references.
9 From Energy Efficiency Fund’s Annual Legislative Reports from 2011 to 2015.
10 From Energy Efficiency Fund’s Annual Legislative Report for 2015.
11 Data from HES/HES-IE Performance numbers reported in CT Statewide Energy Efficiency Dashboard for 2011-2015.
12 Same as above.
13 According to the 2010 U.S. Census, New Haven has 54,967 housing units (48,877 occupied housing units).
14 LED Lighting Study Report (Jan 2016): http://www.energizect.com/sites/default/files/R154%20-%20CT%20LED%20Lighting%20Study_Final%20Report_1.28.16.pdf.
Interconnection Reform: Good for the Grid and the Climate
New York State is currently working to dramatically ramp up the deployment of solar and other distributed generation (DG) technologies in an effort to improve the resiliency and reliability of its electric system as well as to help combat climate change. In these efforts, interconnection reform plays a key role.
Interconnection refers to a state-established procedure that new distributed generation units must follow to connect in parallel with the utility’s distribution system. The interconnection process involves numerous steps and may take several months depending on the technical specifications of the project and the point of interconnection. Projects awaiting interconnection are put into an interconnection queue in the order of application.
In New York, the interconnection queue has been growing steadily, with 4,007 MW of projects in queue as of June 2016, a 38% increase from April 2016. Spurred primarily by a growing interest in community distributed generation (CDG), this unprecedented surge in project applications highlights the importance of proactive queue management to support the proliferation of DG throughout the state.
Interconnection procedure in New York State is governed by statewide rules known as the Standard Interconnection Requirements (SIR). SIR provide a general framework for interconnection application processing, including fees, timelines, and technical criteria.
For many years, SIR incentivized developers to file an application and reserve a place in the queue even if they had no intention of moving forward with their project; and further, SIR provided no process for removing the project from the queue without a customer’s permission. Thus, hundreds of these abandoned projects continue to clog the interconnection queue today.
On April 29, 2016, an update to SIR for systems between 50 kW to 5 MW went into effect, addressing some of the interconnection challenges raised by those involved in recent SIR proceedings. This update:
- Provided for a pre-application report that allows a developer to obtain information about a circuit, including capacity, peak load, and aggregate existing and queued DG, without having to submit a complete application and being placed in queue;
- Established project timelines to ensure that abandoned projects are removed from the queue after 30 days;
- Created a uniform set of technical screens to be used by all utilities for project review and called for uniform technical standards used by utilities to evaluate project feasibility.
However, the new rules are applicable only to project applications submitted after the effective date, and so have done little to resolve the existing queue backlog. Further updates to SIR are expected to address this backlog.
These best practices for queue management are currently being considered by the recently created Interconnection Policy Working Group (IPWG), comprised of utility company, state, and industry representatives. In its most recent straw proposal, the IPWG is seeking to require all pre-April 29th applicants to take action by certain dates to remain in the queue or face removal. For instance, the applicants would be required to provide a landowner consent form within 10 days of a Public Service Commission Order to demonstrate site control and prevent site shopping by the developer.
In addition to addressing the backlog, the IPWG is working to reform interconnection by addressing cost sharing for required substation or distribution-level upgrades. These upgrades can often amount to hundreds of thousands of dollars and make a project cost-prohibitive for a single developer. Under the current rules, the first developer to proceed with a project on a given circuit/substation bears the full cost of upgrades. Any subsequent projects take advantage of those upgrades and forgo the expense. Cost-sharing mechanisms could ensure that every developer benefiting from an upgrade pays their fair share.
Together these reforms could significantly facilitate DG interconnection in New York, resulting in a more reliable, resilient, and efficient system that advances the state’s environmental and climate goals.
What 10 Years of RGGI’s Carbon-Trading Agreement Means for the Future
In the nearly eight years that the program has been fully operational, electricity prices in RGGI states have dropped an average of 3.4 percent. “RGGI states’ experience reducing emissions faster and at lower cost than anticipated comes at an important time,” the Acadia Center wrote in a recent report about RGGI.
Read the full article from Greentech Media here.
Editorial: Carbon limits paying off
A recent report by the Acadia Center, a nonprofit research organization that promotes clean energy and economic growth, found the states participating in RGGI have reported more economic growth than similar states that opted out. That’s not likely a coincidence.
Read the full article from the Albany Times Union here.
RGGI reforms could push states past EPA targets — report
The Regional Greenhouse Gas Initiative, an emissions trading program in the Northeast and Mid-Atlantic, should adopt a number of reforms to set up its nine member states to go above and beyond the targets in U.S. EPA’s Clean Power Plan, a new report says.
The report, “Achieving Climate Commitments,” is the second in a status report on RGGI by the Acadia Center, a clean energy research group based in the Northeast.
Read full article from E&E News here.
Achieving Climate Commitments: Strengthening RGGI to Achieve State and Federal Requirements
BOSTON — Part II of Acadia Center’s status report on the Regional Greenhouse Gas Initiative (RGGI), Achieving Climate Commitments, describes reforms that northeast and mid-Atlantic States need to implement during the 2016 Program Review to achieve state and federal greenhouse gas reduction requirements, including:
- Aligning the emissions cap with states’ GHG reduction requirements and extending the cap to 2031.
- Adjusting for banked allowances to preserve RGGI’s effectiveness.
- Strengthening the Cost Containment Reserve to prevent inflation of the RGGI cap.
“RGGI continues to prove itself as an effective means of reducing carbon emissions and supporting economic growth. Now, northeast and mid-Atlantic states have an opportunity to build on RGGI’s success and lead the country by taking the steps necessary to meet state and federal climate requirements,” said Daniel L. Sosland, Acadia Center President.
Each of the RGGI states has committed to reducing emissions by approximately 40% across their economies by 2030, and eight of the nine participating states have established 2050 requirements for 80% reductions. By reducing emissions in the electric sector — and reducing emissions associated with electricity use in transportation and heating — RGGI will play a central role in achieving state requirements.
“RGGI is one of the most effective tools for states to reduce climate pollution,” said Peter Shattuck, Director of Acadia Center’s Clean Energy Initiative. “RGGI can and should play a central role in achieving commitments states have made to address climate change.”
Reforms to RGGI are also being considered in the context of the Obama Administration’s Clean Power Plan, the first-ever national limits on carbon pollution from existing power plants.
“As other states develop initial plans to meet the base requirements of the Clean Power Plan, RGGI states can be climate leaders and go above and beyond minimum federal requirements,” said Jordan Stutt, Policy Analyst at Acadia Center and lead author of the report.
The report builds on Regional Greenhouse Gas Initiative Status Report, Part I: Measuring Success which describes RGGI’s accomplishments since RGGI’s launch, including: 37% emissions reductions and a 3.6% decline in region-wide electricity prices. 16% more emissions reductions and 3.6% more economic growth than other states.
For more information on Part I of the RGGI Status Report, Measuring Success see: acadiacenter.org/document/measuring-rggi-success
For more information on Part II of the RGGI Status Report, Achieving Climate Commitments see: acadiacenter.org/document/rggi-achieving-climate-commitments
###
Acadia Center is a non-profit, research, and advocacy organization committed to advancing the clean energy future. Acadia Center is at the forefront of efforts to build clean, low-carbon, and consumer friendly economies. Acadia Center provides accurate and reliable information and offers a real-world and comprehensive approach to problem solving through innovation and collaboration.
Public Supports Strengthening RGGI to Fight Climate Change
The next bit of good news is that—as outlined by our friends at the Acadia Center—there is much the RGGI states can do to strengthen the program so it continues to deliver benefits to our climate. RGGI works by requiring power producers in the region to buy carbon allowances at quarterly auctions or on the secondary market to cover each ton of carbon they emit, with the number of allowances declining each year. The states then use the auction revenue to support consumer programs, with the vast majority of the cash going toward energy efficiency; renewable energy; direct bill assistance; and other greenhouse gas abatement programs. As mentioned above, these investments have generated billions of dollars in regional benefits, and to keep these benefits flowing, the RGGI states must commit to further carbon pollution reductions after 2020, Acadia shows. As we’ve highlighted before, and Acadia further discusses, in addition to the cap trajectory, the RGGI states must also reform the cost containment reserve and how they treat unused, banked allowances in order to avoid undermining the climate integrity of the program.
Read the full blog post from NRDC here.
Pioneering Carbon-Cutting Program Turns 10: What Now, RGGI?
Despite the usual Chicken Little critics’ warnings that RGGI would tank the region’s economy, the opposite has happened. As member states cut carbon pollution by 16 percent more than non-RGGI states, they saw economic growth that was 3.6 percent higher, according to a recent report by our colleagues at the Acadia Center. And while electricity prices in the rest of the country climbed by 7.2 percent, they dropped in the RGGI region by 3.4 percent. In other words, the RGGI states both cut emissions and grew their economies faster than other states, all while experiencing declining average electricity prices—and bills. That’s not an implosion. It’s a home run.
Read the full blog post from NRDC here.